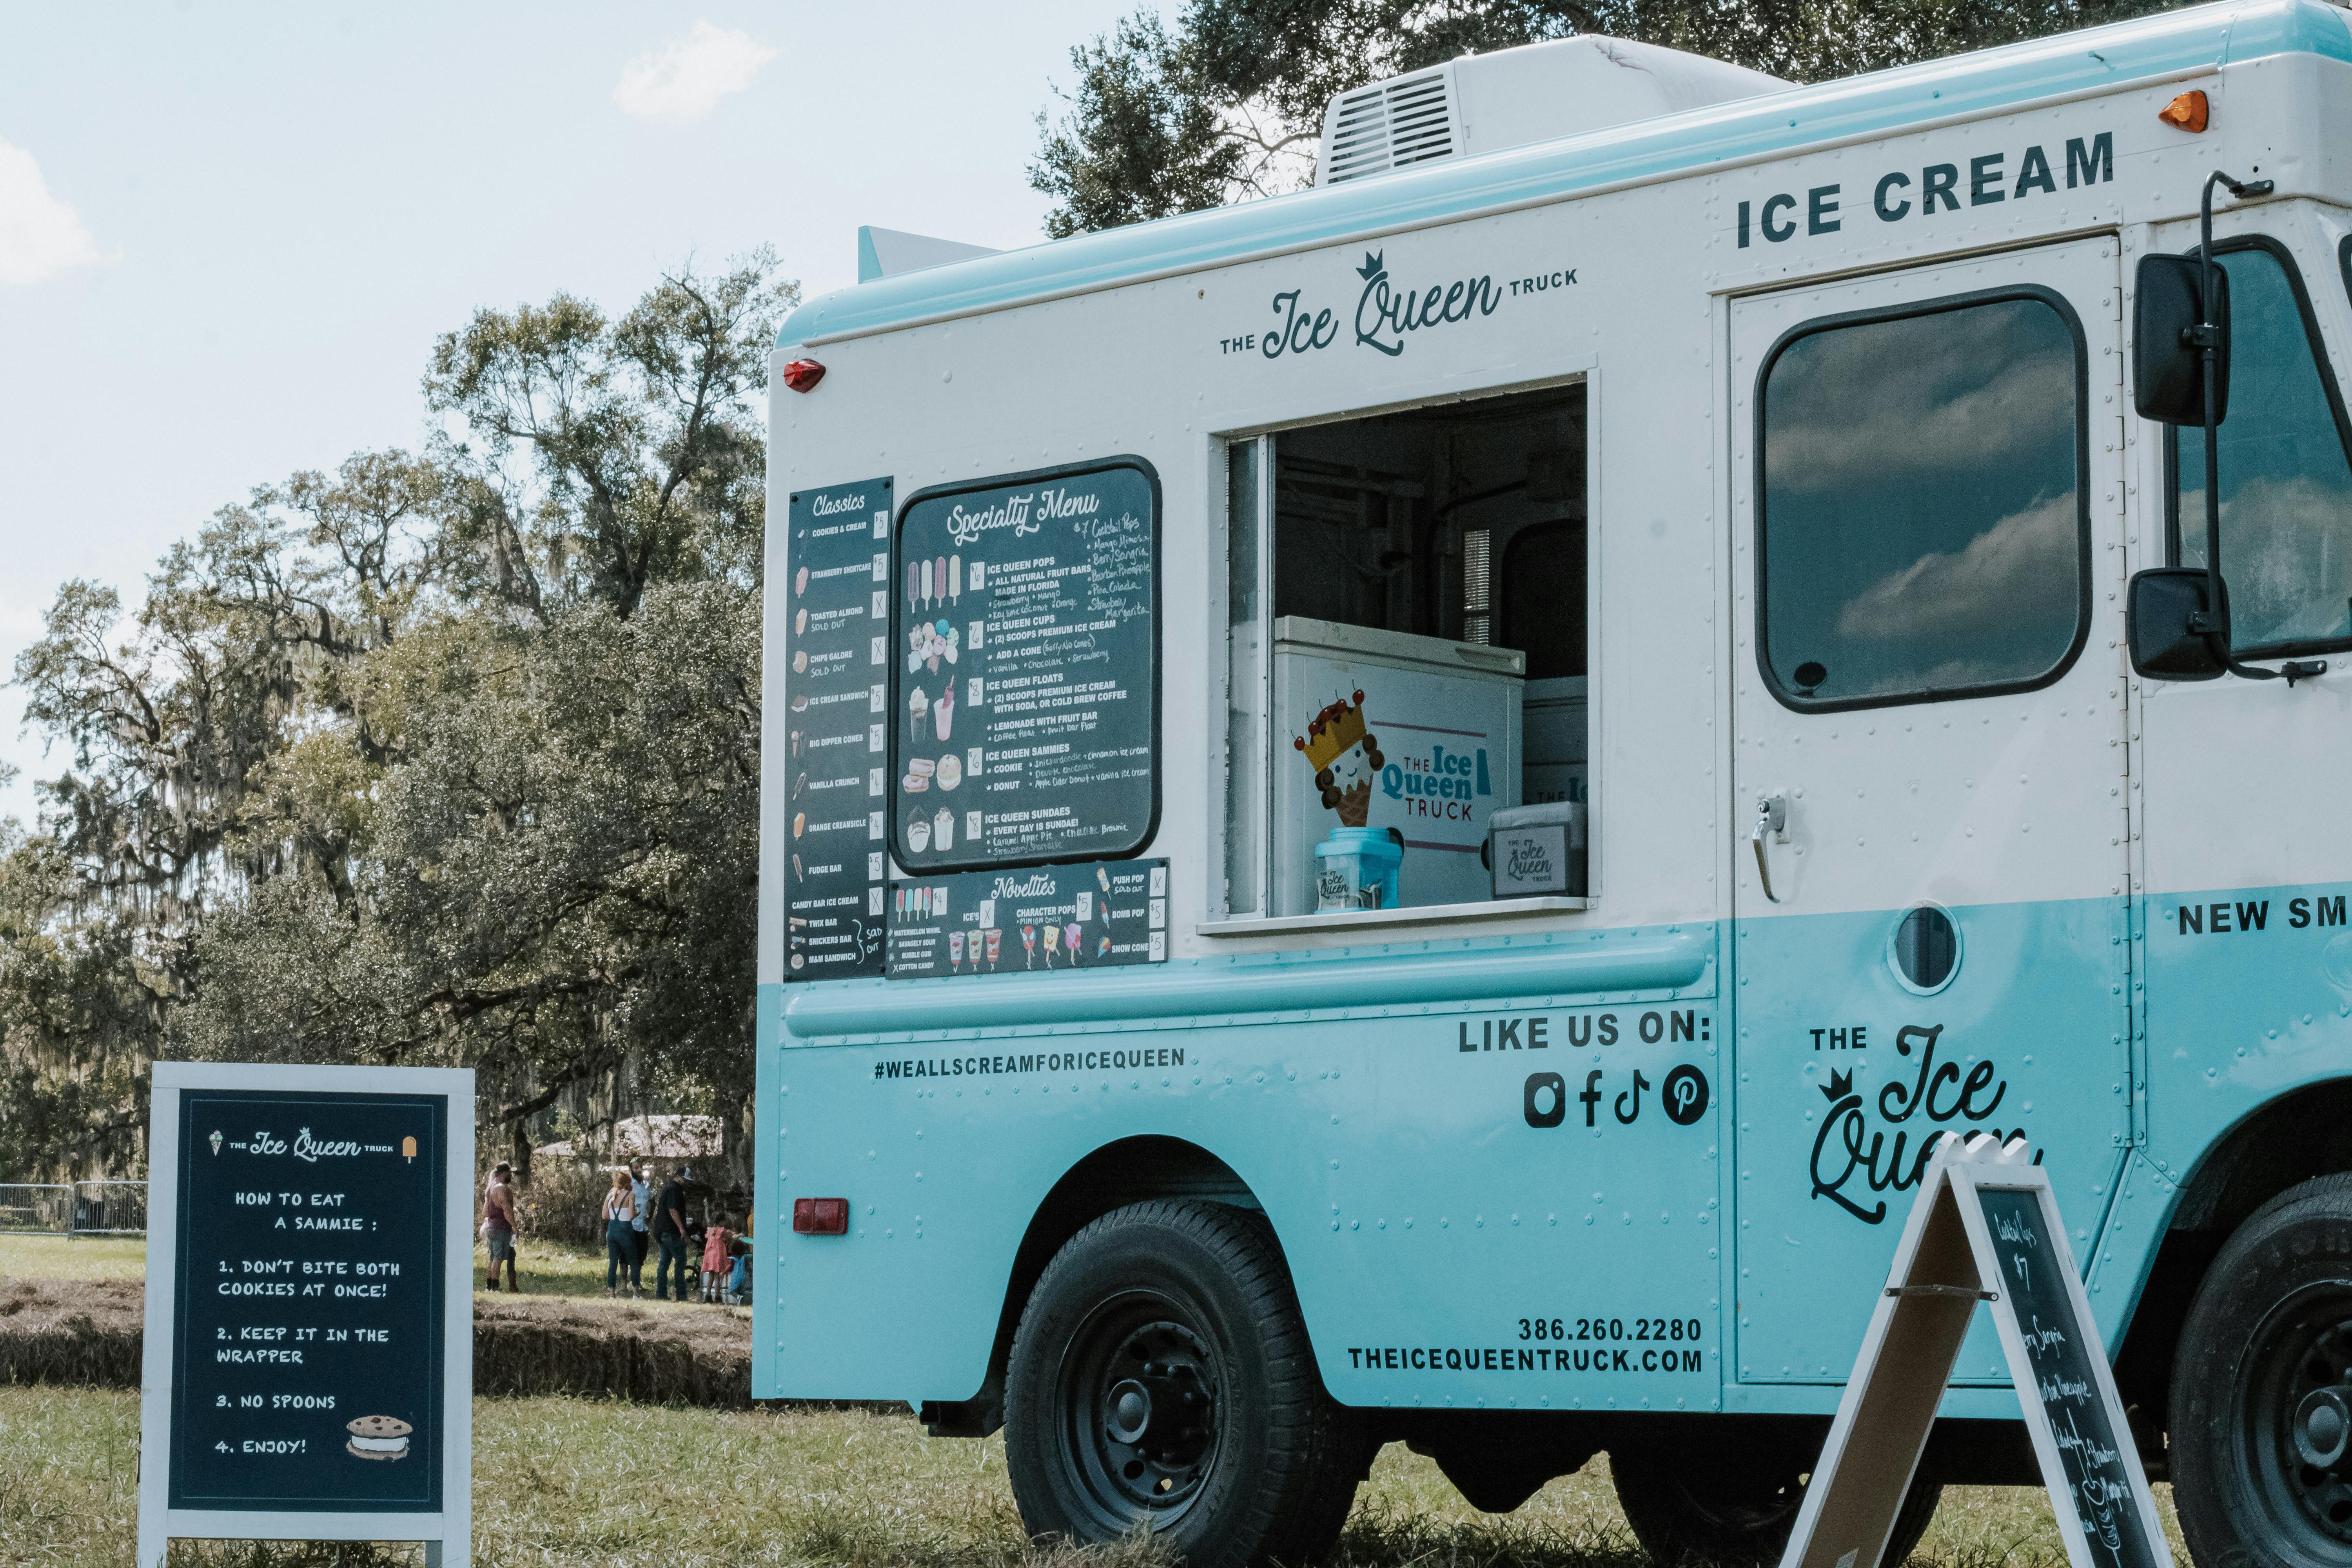
The anchor location is the one a food truck owner thinks of first when they think about their business. It is the location with the longest history, the most loyal regulars, the clearest sense of identity and routine. When it performs well, everything feels right. When it has a bad week, the whole week feels off.
The anchor gets the most attention, the most menu development consideration, the best scheduling. And for that reason, it is often the location where the operator has already captured most of the available performance improvement. The marginal return on additional focus is lower than it appears.
What the Performance Distribution Usually Shows
When food truck operators look at their location performance data carefully — comparing average ticket values, transaction volumes, margin efficiency, and trends over time — the distribution is rarely as steep as their mental model suggests. The anchor is usually strong, but the gap between the anchor and the second-best stop is often smaller than owners assume, and the second stop is frequently trending more positively because it has been less fully optimized.
The third and fourth stops on the regular rotation often show even more interesting patterns — locations that underperform in raw volume but carry favorable margins, or locations where a specific operational change could meaningfully improve results.
Businesses who know their full location performance distribution with precision find opportunities in their existing schedule that they did not know were there. The insight is not about adding new stops — it is about understanding what the current ones are actually worth.
The Reallocation Opportunity
When performance data reveals that a location is performing better than expected — or has more upside than the current scheduling investment reflects — the response is usually straightforward. More frequent visits, better timing within the day, additional menu development oriented toward that location's customer mix, or simply more focused attention during service.
These are not expensive changes. They are scheduling and focus reallocations that cost nothing but require knowing which opportunities they apply to. That knowledge comes from looking at your location performance with enough structure and consistency to see what is actually there rather than what feels true.
The Case for Regular Location Audits
The best food truck location strategy is not static — it evolves as neighborhoods change, as competition shifts, and as your own operational capabilities develop. The operators who stay ahead of that evolution are the ones reviewing their location performance regularly rather than defaulting to a schedule they built two years ago and have not seriously reconsidered since.
That regular performance review is exactly what Savoir makes possible every week — so your location strategy is always based on current data rather than accumulated habit.
Savoir means to know. And you will.